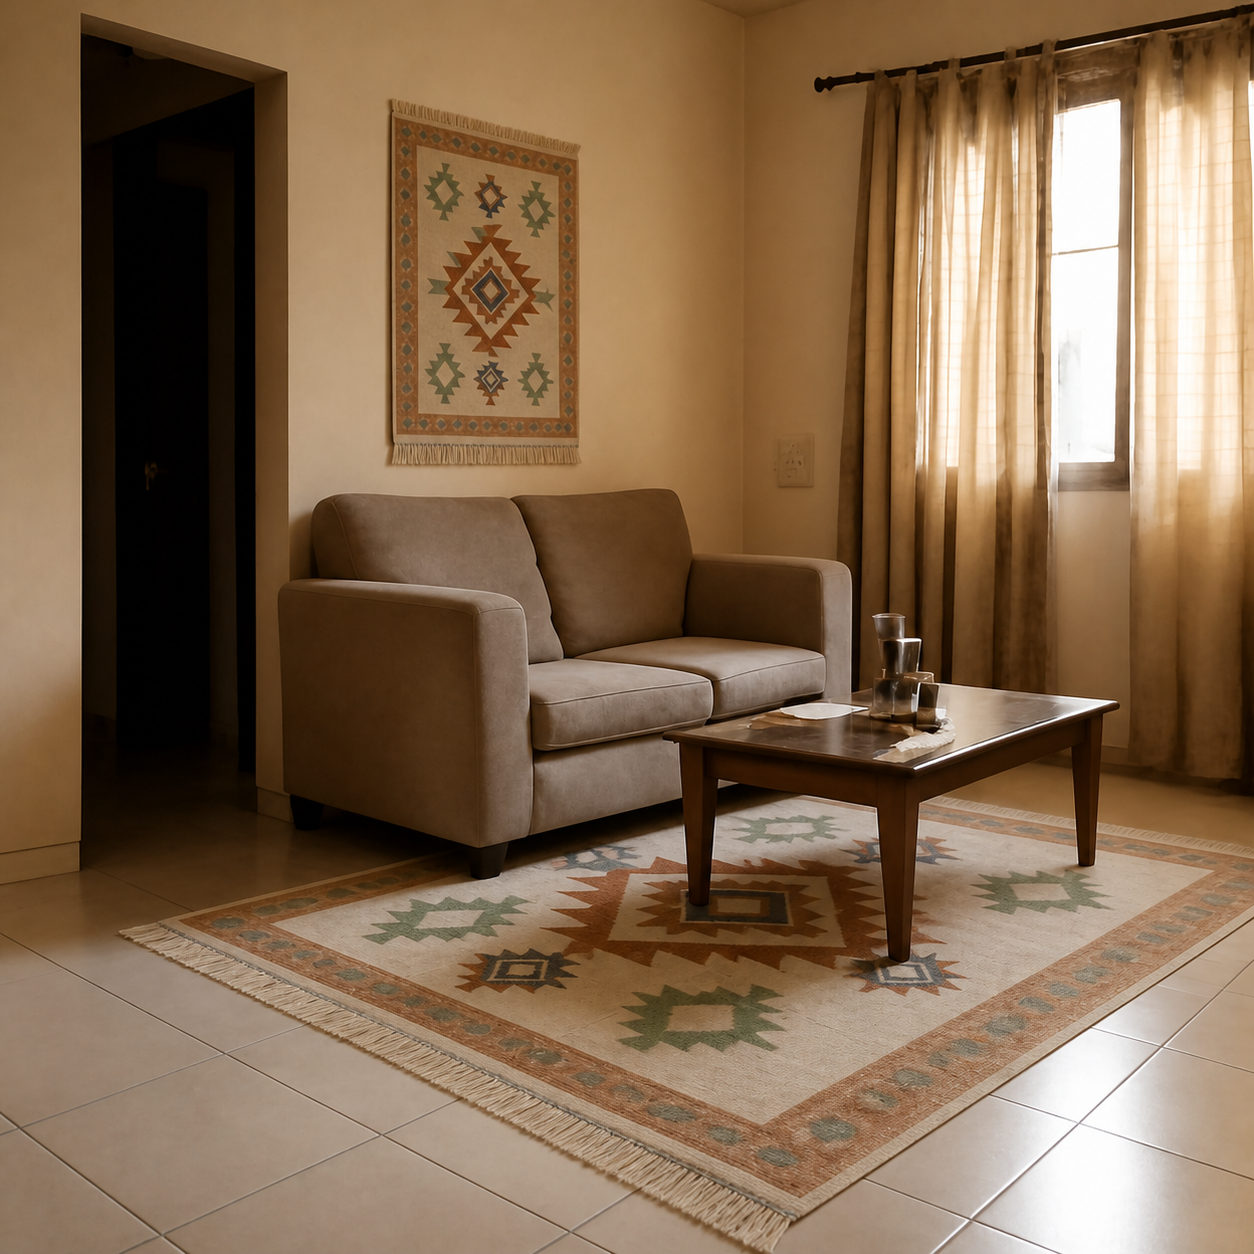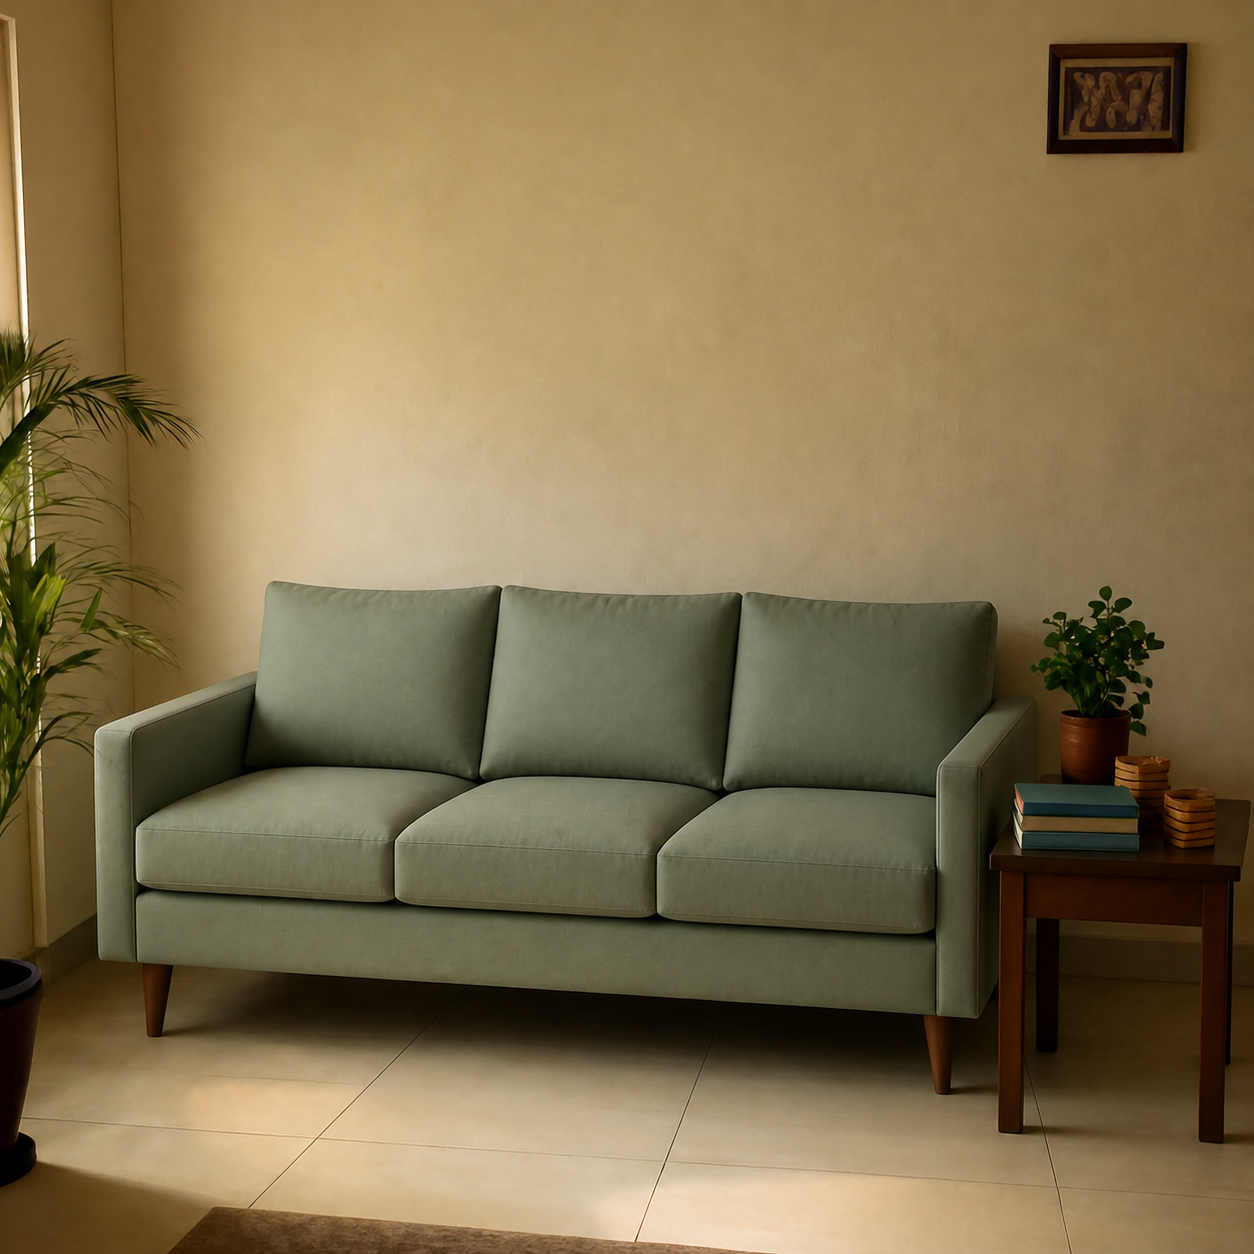
Online furniture has one of the highest return rates of any retail category. Industry research consistently puts return rates for online furniture between 20% and 30%, compared to roughly 8–10% for brick-and-mortar furniture purchases. The dominant reason is the same year after year: the item didn't look or fit the way the buyer expected. Here is what the numbers say, what causes them, and why “previewing before buying” is the highest-leverage thing a shopper can do.
The return-rate range
No single authoritative number exists — the rate varies by retailer, category, and method of measurement. The best public benchmarks:
| Source | Category | Reported range |
|---|---|---|
| Narvar State of Returns (2023) | Online furniture / large items | ~20–25% |
| Statista e-commerce returns | Online retail (all categories) | ~18–22% |
| NRF Consumer Returns | Online retail (US, all) | ~17% |
| Optoro reports | Furniture + home (online) | ~25–30% |
Brick-and-mortar furniture, by contrast, sits much lower — typically cited at 8–10%. The gap is because the in-store buyer has already seen the piece, sat on it, and judged the scale before paying.
Why the returns happen
Industry research breaks the reasons into roughly the same buckets, year after year:
- Looks different than expected (~60-70%): wrong scale against the buyer's other furniture, colour reads differently in their light, fabric texture not as photographed.
- Damaged in transit (~15-20%): furniture is fragile in shipping. A scratched leg or torn upholstery means an immediate return.
- Doesn't physically fit (~10%): didn't make it through the door, around the stairwell turn, or onto the wall it was bought for.
- Quality / construction (~5-10%): assembly issues, wobbly joints, or the piece is noticeably cheaper-feeling than the photos suggested.
The pattern: the largest cause of returns is something a photo preview can catch before the order ships.
Returns by sub-category
Within furniture, three sub-categories consistently top return rankings:
- Rugs — most-returned home category, with size mismatches the dominant cause.
- Sofas + sectionals — second-highest by volume, dominated by visual scale and colour issues.
- Beds + bedframes — high because of size mismatch with the bedroom and partner.
What this costs everyone
For the seller, a 25% return rate on furniture is brutal. The average cost of a furniture return is several hundred dollars when you factor freight, white-glove pickup, restocking, and resale markdown. The cost breakdown is here.
For the buyer, the cost is time (typically 6-8 weeks from delivery to refund) and the partial fees that sellers increasingly pass through — return shipping, restocking, and original outbound shipping fees that aren't refundable.
For the environment, industry research from Optoro and others consistently shows that a meaningful share of returned furniture never resells — it ends up in liquidation, donation, or landfill.
Why previewing works
If the majority of returns are caused by “looks different than expected,” the highest-leverage intervention is making the buyer see what it'll actually look like. A photo preview that composes the exact product into the buyer's own room is meaningfully closer to the in-store experience than any product listing — and it's available for every product on every site.
Try a preview of anything you're about to order at PlopIt — free, no signup, works with any product link.
Sources
Ranges in this article are drawn from publicly cited industry reports including Narvar State of Returns, National Retail Federation Consumer Returns, Statista e-commerce return data, and Optoro reverse-logistics research. Exact figures vary by year, retailer, and how returns are categorised. Treat percentages as benchmark ranges, not single-point statistics.